
hidden profits found inside restaurant operations
Each of the case studies below comes directly from live operator data.
optimized vendor ordering
result: 10% savings on cost of goods
Summary: A multi-unit restaurant group was ordering from vendors based on convenience rather than price.
We coordinated with the vendors to receive weekly price sheets and custom built a system that automatically compares vendor prices by item. The purchasing team now uses an organized list that details the best vendor for each item that week.
By implementing this repeatable weekly ordering system, the group has reduced their cost of goods by 10%.

closing efficiency report
result: 40% savings on closing costs
Summary: Closing shifts were running too long without enough late-night sales to justify the labor. We analyzed closing-hour performance for each day of the week and found that on certain nights, the gap between late-night sales and cost to close was consistently too wide.
Using this insight, schedules were tightened on slower nights, side work was shifted earlier in the day, and staff were coached on creating urgency around closing processes. Within a few months, the team brought their average closing costs down by 40%, and have sustained those improvements for nearly a year.

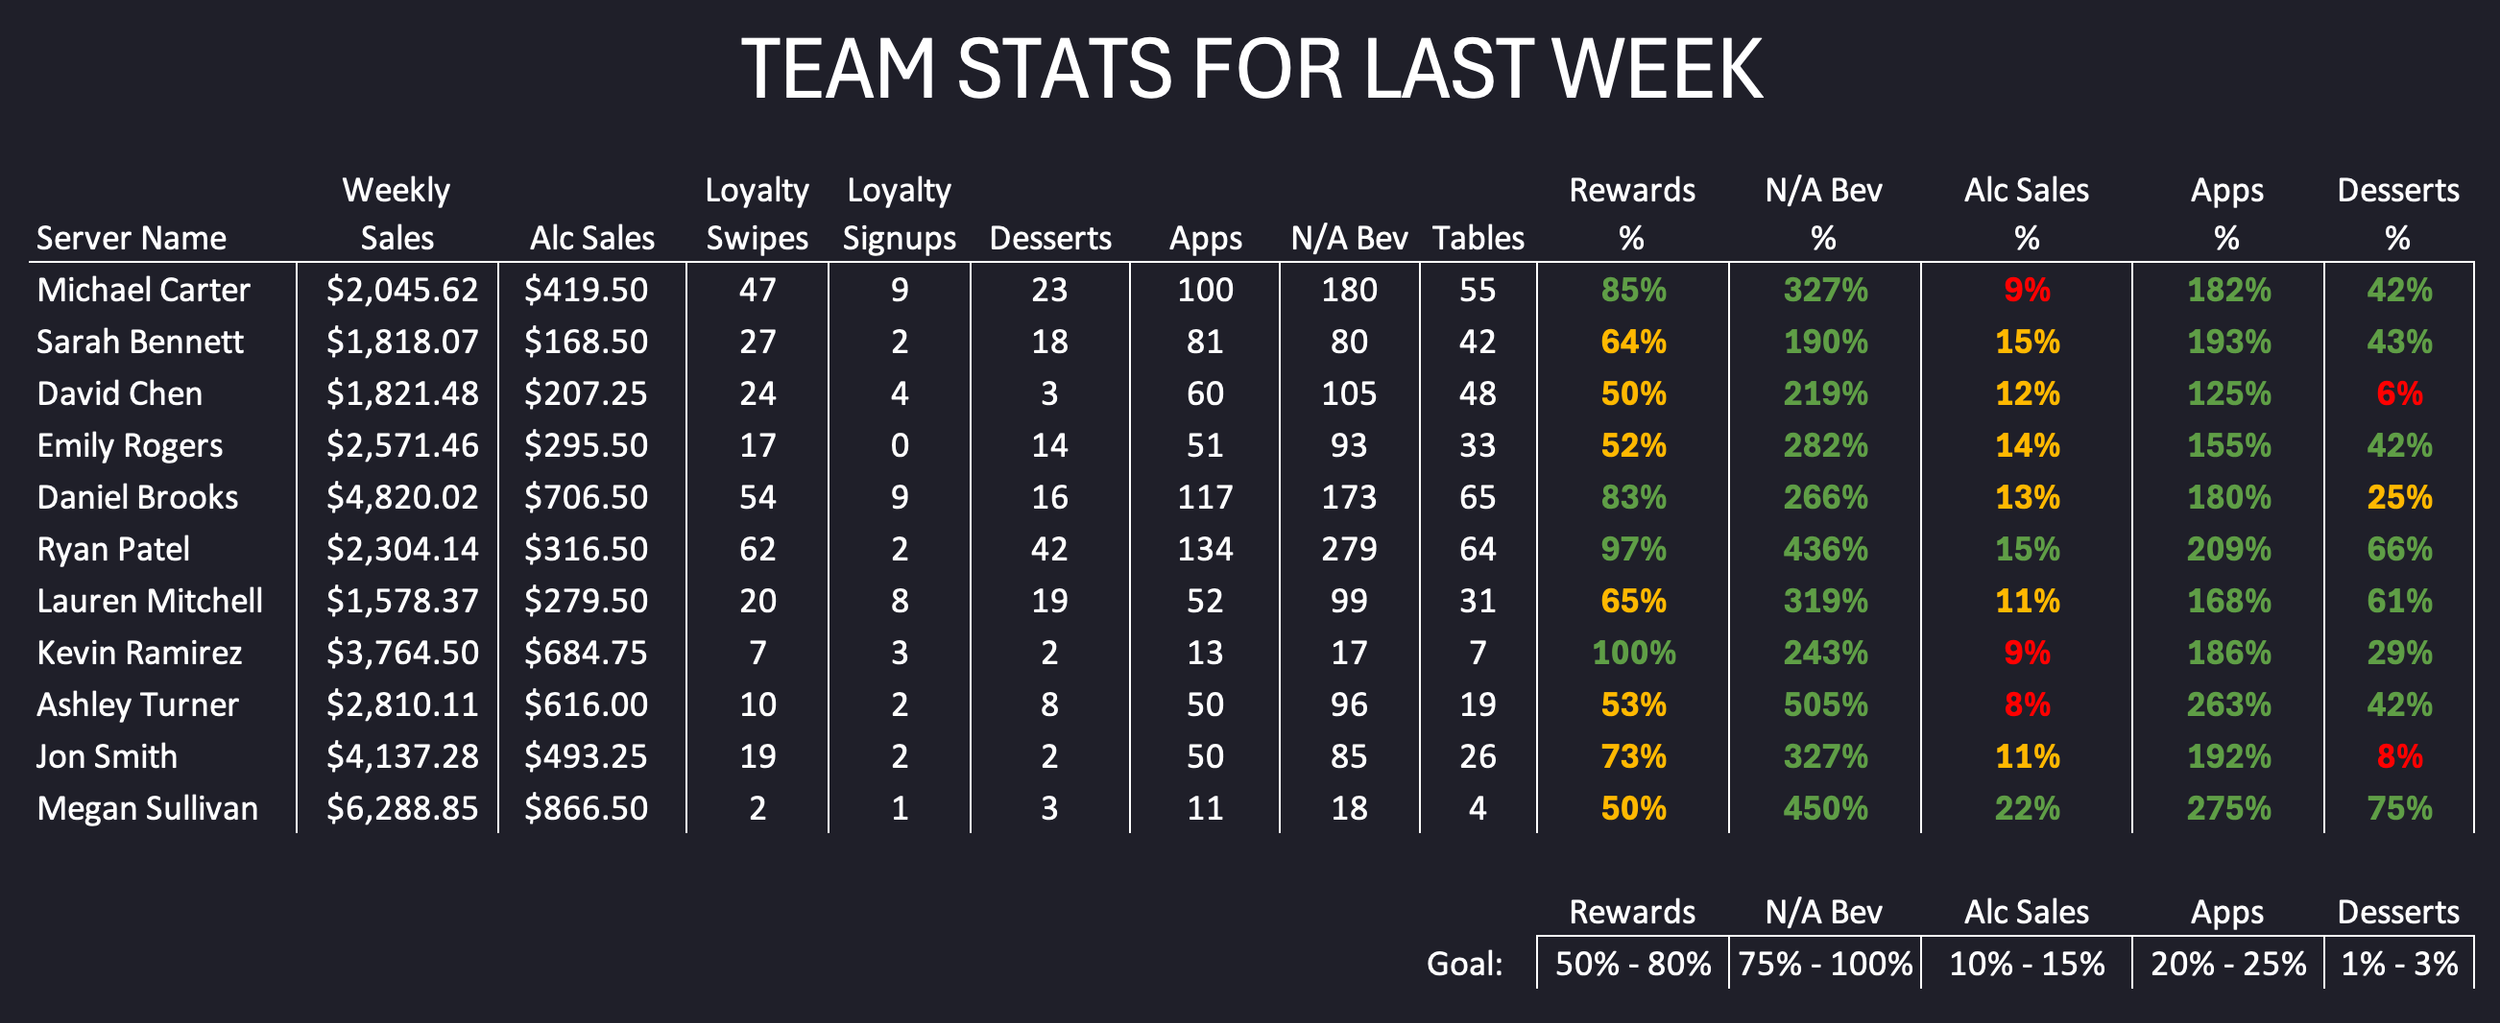
weekly server stats
result: tools for managers to improve performance
Summary: A lot of the operators have no clear way to measure staff performance in a meaningful and actionable way. Without clear performance data, coaching conversations can be vague and scheduling decisions are often based more on intuition than results.
To solve this, I custom built a team tracking system that includes team rankings and individualized server scorecards. Each server receives a weekly performance breakdown across key metrics, think of it as a digital “baseball card” for every member of the wait staff.
By ranking servers on the same metrics, managers gain clear visibility into who is excelling and who may need additional support. It also introduces a healthy level of friendly competition, encouraging top performers while creating targeted opportunities for coaching and improvement.
If you’re curious what opportunities may be hiding inside your own operation, I’m happy to take a look.